
Having a good grasp of networking tools can make a significant difference in your ability to troubleshoot issues, optimize performance, and assist with network-related problems. Whether you’re an IT apprentice just starting out or a seasoned professional, familiarising yourself with these tools can help you stand out and make valuable contributions to your team. In this post, I’ll explore some essential networking tools that every IT professional should know.
5 Essential Command Line Tools you need to know in Windows, Linux and Mac (Command Prompt / PowerShell / Bash) for Networking
You’ll encounter various network-related challenges throughout your career. Having the right tools in your arsenal can make all the difference when it comes to diagnosing issues, optimizing performance, and ensuring the smooth operation of your organization’s network infrastructure. Starting off with a basic..
1. Ping
“Ping” is a simple yet an essential command-line tool that allows you to test the reachability of a host on an IP network.
Here’s how you would typically use the Ping command:
- Bash/Linux/macOS:
ping example.com - Command Prompt (Windows):
ping example.com - PowerShell (Windows):
Test-Connection -ComputerName example.com
1.2 Introducing the Most Helpful Command: “Help”!
Before diving into the commands I’m about to share, it’s crucial to familiarize yourself with the built-in help functions of the command line interface. This will not only make it easier to understand the commands but also save you time when you need to troubleshoot or look up information. Instead of searching online or in manuals, you can quickly access the help documentation right within the command line. So, before trying out any of the commands in this post, take a moment to explore the help options available to you. Trust me, it’ll be a lifesaver in the long run!
Bash (Linux or macOS)
Command: man [command]
Explanation: Use the man (short for manual) command followed by the command you need help with. This displays a detailed manual page with descriptions, options, and usage examples for the specified command. For quick help, you can also use command --help or command -h.
Example: man ping or ping --help
Windows Command Prompt
Command: [command] /?
Explanation: In Windows Command Prompt, you typically add /? after a command to get brief help information about its usage and options.
Example: ping /?
PowerShell (Windows)
Command: Get-Help [command]
Explanation: PowerShell provides a comprehensive help system via the Get-Help cmdlet. You can use this cmdlet followed by the name of the command to get detailed help, including examples, parameters, and notes. For a more summarized version, you can add -Summary.
Example: Get-Help Test-Connection
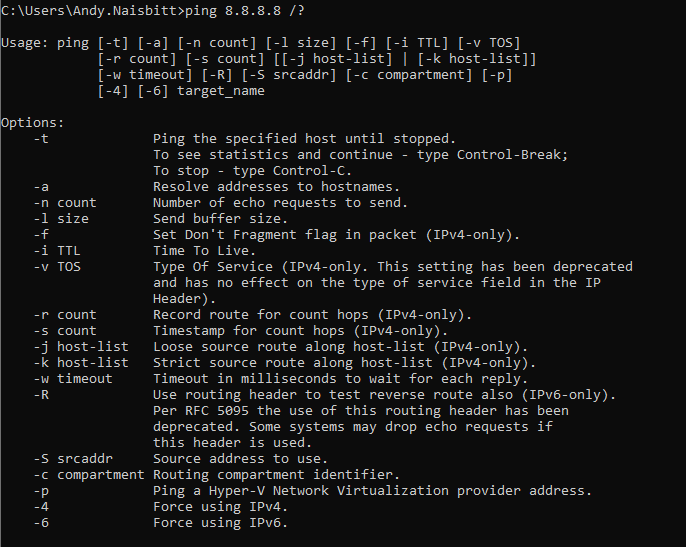
In my example here, I put a slash and a questionmark after the full command “ping 8.8.8.8” this displayed the help and usage for the command 🙂 handy right?
By sending ICMP echo requests to a target host, ping can help you determine whether the host is accessible and measure the round-trip time for messages sent between the source and destination computers. This tool is often the first step in diagnosing network connectivity issues.
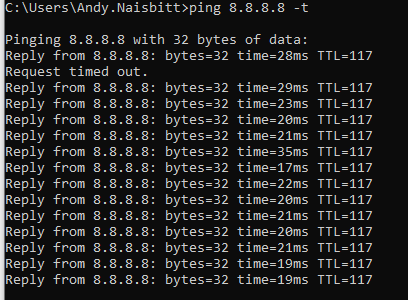
Type Ping into the command line followed by your desired target or IP address, followed by a switch, or basically one of the many parameters available from the list above. I chose to use the -t to continuously ping the target being 8.8.8.8 (Googles DNS server) which is perfectly fine to use.
Analysing Ping Results
Looking at the results above… after the timeout, the ping responses resumed with consistent timings, mostly around 20ms, which is relatively quick and shows that the connection to the DNS server was reestablished promptly. The TTL (Time To Live) value of 117 is also noted, which indicates the number of hops the packet is allowed before it is discarded; in this case, it can hop through 117 more devices or routers.
The Time to Live (TTL) value is an important aspect of IP packets sent over a network, including those used by the ping command. Here’s a deeper look into what it means and how it functions:
TTL stands for Time to Live, and it is a field in the Internet Protocol (IP) header of a packet. The TTL value is an 8-bit field, so it can range from 0 to 255.
In my example, packets being sent to Google’s DNS server (8.8.8.8) have a TTL of 117 when they arrive back at your computer. This means the packets were configured with a higher TTL value, and 117 is what remained after the number of hops necessary to travel from your computer to Google’s server and back. Each hop reduces the TTL by one or sometimes more, depending on the network path and router configurations.
The primary purpose of the TTL field is to prevent data packets from circulating indefinitely on the network. This can happen due to routing loops or other network errors. The TTL helps in managing the lifespan of a packet to avoid network congestion and potential breakdowns caused by these “immortal” packets.
How does TTL Work?
- Initialization: When a packet is created, its TTL value is set, typically by the operating system of the host sending the packet. The initial TTL value can vary based on the operating system or even configurations within networking software.
- Decrement Process: As the packet travels through each router (or hop) on its route to the destination, the TTL value is decremented by 1 by each router it passes through. Some systems may decrement TTL by more than 1 if the time taken to process the packet is longer, but this is less common.
- Packet Discard: If the TTL value reaches 0 before the packet reaches its final destination, the packet is discarded (dropped) by whichever router currently has it. The router that drops the packet typically sends an ICMP (Internet Control Message Protocol) message back to the sender, indicating that the packet was dropped due to the TTL expiring.
2. Traceroute, tracert & Test-NetConnection (Trace Route)

Traceroute is another useful command-line tool that helps you track the route taken by packets across an IP network. It shows you the path data takes from your computer to a destination host, along with the latency between each hop. This information can be invaluable when diagnosing network issues and identifying potential bottlenecks or routing problems.
Here’s how you would use the equivalent of the traceroute command for tracing network paths on different operating systems:
- Bash/Linux/macOS:
traceroute example.com - Command Prompt (Windows):
tracert example.com - PowerShell (Windows):
Test-NetConnection -ComputerName example.com -TraceRoute
How Traceroute Can Optimize Your Network Troubleshooting
By using traceroute, you can:
- Identify Problematic Network Hops – pinpoint the exact location of a network issue, whether it’s a problem with a specific router, a high-latency link, or a misconfigured firewall.
- Detect Packet Loss – if packets are dropped along the route, trace route will show you this and potentially guide you to the problematic segment of the network
- Diagnosing Firewall and Security Configurations – Sometimes, firewalls or security devices can block or reroute traffic in unexpected ways.
Traceroutecan help reveal if a security configuration is causing connectivity issues or delays, allowing network administrators to adjust settings appropriately.
Each command will detail the hops between your system and the destination, along with the time each hop takes.
Let’s say you’re trying to reach Google, and you run this command: tracert 8.8.8.8
The output might look something like this (IP addresses and hostnames are masked for security):
Tracing route to dns.google [8.8.8.8]
over a maximum of 30 hops:

  1     4 ms     2 ms     2 ms  192.168.*.*
  2    15 ms    17 ms    12 ms  10.*.*.109
  3    13 ms    15 ms    16 ms  **-core-2a-ae43-650.network.**
  4     *        *        *     Request timed out.
  5    22 ms    22 ms    20 ms  **-ic-9-ae0-0.network.**
  6    30 ms    30 ms    31 ms  86-14-250-212.static.**
  7    30 ms    26 ms    27 ms  216.239.*.*
  8    28 ms    25 ms    24 ms  192.178.*.*
  9    22 ms    22 ms    20 ms  dns.google [8.8.8.8]

Trace complete.
Security Implications of Traceroute: I’ve masked the IP addresses and DNS names above with *
While Traceroute is incredibly useful, it’s also a bit of a double-edged sword. If you post your Traceroute results publicly, you might inadvertently reveal details about your internal network infrastructure or ISP. This could give potential attackers clues about how to breach your network. mask sensitive information in Traceroute outputs, like internal IP addresses and specific server names, before sharing them.
Exploring a Traceroute Example: How Data Travels Through the Network
Here we will disect the results of a trace route I ran earlier today to help you understand how data packets navigate through various network points to reach their destination. My example explains what happens when you run a traceroute to a popular DNS service like Google’s at 8.8.8.8.
Start
Hop 1: 192.168._._
What’s Happening: This address is your home router, the first point of exit for your data on its journey. The response times—4 ms, 2 ms, and 2 ms—indicate a swift and healthy response from your local network.
Hop 2: 10._._.109
What’s Happening: This hop is within the private network range, typically assigned to devices within an ISP’s internal network. It shows that the data has left your home network and is now with your ISP, moving towards its backbone.
Hop 3: _-core-2a-ae43-650.network._
What’s Happening: This represents a core router deep within the ISP’s network. The router’s identifier is partially obscured for privacy, but it suggests a central role in routing traffic across the network.
Hop 4: Request timed out.
What’s Happening: Here, no response was received. This could be because the router is configured not to respond to ICMP requests used by traceroute, or the request could have been dropped due to congestion or filtering.
Hop 5: _-ic-9-ae0-0.network._
What’s Happening: Another crucial router within the ISP’s framework, likely involved in interconnecting different network segments or possibly managing international traffic, indicated by the obscured identifier.
Hop 6: 86-14-250-212.static.*
What’s Happening: This static IP suggests a stable, unchanging IP address within your ISP’s domain. It likely signifies a significant network node, possibly serving as a gateway to other networks or ISPs.
Hop 7: 216.239._._
What’s Happening: This hop transitions the packets from your ISP to Google’s network. The IP block is owned by Google, indicating that your data is now routing through Google’s expansive network infrastructure.
Hop 8: 192.178._._
What’s Happening: A deeper move into Google’s network, this hop suggests nearing the final destination as your packets are handled by increasingly specific and localized Google servers.
Hop 9: dns.google [8.8.8.8]
What’s Happening: The final destination. This well-known Google DNS server responds with low latencies (22 ms), confirming a healthy and efficient route from your device through the ISP and into Google’s network.
Understanding these hops and what they represent helps demystify the complex paths data takes across the internet. Each hop can tell us a lot about the architecture of both the public internet and private networks, including potential bottlenecks or security filters. It’s a window into the invisible infrastructure that powers our online experiences.
When sharing traceroute results, especially in public forums or blogs, it’s critical to obscure specific IP addresses and identifiers to prevent potential security risks. This doesn’t just protect your privacy—it also shields your network from potential threats that can arise from exposing detailed network infrastructure publicly.
This real-world example illustrates how traceroute can be a powerful tool in network troubleshooting, providing clear insights into traffic routing and network health. Whether you’re a network professional or just curious about how the internet works, understanding traceroute enriches your knowledge and can aid in more informed troubleshooting and network management.
3. IP Configuration (IPConfig/IFconfig commands)
Understanding IP Configuration Tools: ipconfig and ifconfig
When it comes to the essentials of network troubleshooting and management, understanding IP configuration tools like ipconfig for Windows and ifconfig for macOS and Linux is crucial. These commands are indispensable for IT professionals and are your go-to solutions for most network-related issues.
ipconfig
Primarily used in Windows operating systems for viewing and configuring IP network settings.
ifconfig
Commonly utilized in macOS and Linux systems to configure network interfaces and display network information.
Common Use Cases
Renewing IP Configuration
If you ever find yourself needing to change network settings or troubleshoot connectivity issues, ipconfig is your first line of defense. For instance, renewing your IP configuration can be as simple as running ipconfig /release followed by ipconfig /renew. This process requests a new IP address from your DHCP server, essential when changes in the network environment occur.
DNS Management
Consider a scenario where you switch a virtual server to another DNS server. Post-migration, you might encounter domain connectivity issues due to stale DNS information. Here, ipconfig /flushdns becomes invaluable. This command purges the DNS resolver cache, ensuring that your system starts using the new DNS settings immediately, which is critical for joining systems to new domains without hiccups.
Understanding ipconfig Output
Microsoft Windows [Version 10.0.19045.4412]
(c) Microsoft Corporation. All rights reserved.

C:\Users\Andy.Naisbitt>ipconfig

Windows IP Configuration

Ethernet adapter Ethernet 2:
   Media State . . . . . . . . . . . : Media disconnected
   Connection-specific DNS Suffix . :

Ethernet adapter Ethernet 5:
   Media State . . . . . . . . . . . : Media disconnected
   Connection-specific DNS Suffix . : cable.virginm.net

Ethernet adapter vEthernet (WiFi):
   Connection-specific DNS Suffix . :
   Link-local IPv6 Address . . . . . : fe80::769a:c4d7:d3d6:eb38%68
   IPv4 Address. . . . . . . . . . . : 172.29.240.1
   Subnet Mask . . . . . . . . . . . : 255.255.240.0
   Default Gateway . . . . . . . . . :

Wireless LAN adapter Local Area Connection* 9:
   Media State . . . . . . . . . . . : Media disconnected
   Connection-specific DNS Suffix . :

Wireless LAN adapter Local Area Connection* 10:
   Media State . . . . . . . . . . . : Media disconnected
   Connection-specific DNS Suffix . :

Ethernet adapter Ethernet 3:
   Media State . . . . . . . . . . . : Media disconnected
   Connection-specific DNS Suffix . :

Wireless LAN adapter WiFi:
   Connection-specific DNS Suffix . : cable.virginm.net
   Link-local IPv6 Address . . . . . : fe80::1eb:ec3a:103a:870f%8
   IPv4 Address. . . . . . . . . . . : 192.168.0.43
   Subnet Mask . . . . . . . . . . . : 255.255.255.0
   Default Gateway . . . . . . . . . : 192.168.0.1

Ethernet adapter Bluetooth Network Connection:
   Media State . . . . . . . . . . . : Media disconnected
   Connection-specific DNS Suffix . :
The provided ipconfig output shows the network configuration for various adapters on a Windows system. Let’s break it down:
- The system has multiple Ethernet and wireless adapters, some of which are disconnected (Media State: Media disconnected).
- The connected adapters have their respective IPv4 addresses, subnet masks, and default gateways listed.
- Some adapters also have IPv6 link-local addresses assigned.
- Connection-specific DNS suffixes are displayed for certain adapters, indicating the DNS domain associated with the connection.
- Virtual Ethernet adapters (vEthernet) are present, likely associated with virtualization software or VPN connections.
This information helps in identifying the active network connections, their IP configurations, and any potential issues related to connectivity or IP address conflicts.
4. Netstat & Get-NetTCPConnection
Netstat stands as a universally respected command-line tool that’s indispensable for IT professionals across all platforms. Whether you’re troubleshooting a network issue, monitoring ongoing connections, or just keeping an eye on your network’s pulse, netstat provides the essential data you need.
Netstat Usage Across Operating Systems
macOS/Linux Commands
View all ports and connections
netstat -an
This command lists all active connections and listening ports, showing you the full scope of network activity.
Filter by TCP and UDP
netstat -aut
Ideal for monitoring specific types of traffic, this command helps you focus on active TCP connections and UDP ports.
Identify process-port relationships
netstat -tulpn
Knowing which process is using which port can be crucial, especially when you’re sniffing out suspicious activity. (Note: Run with sudo for detailed access.)
Windows Command Prompt
See all connections and listeners
netstat -an
Just like on macOS/Linux, this gives a comprehensive view of all network connections and open ports.
Link connections to applications
netstat -ab
This is particularly useful for cybersecurity, as it connects ports to the executables, making it easier to spot potentially harmful software.
PowerShell Specific Command
Detailed TCP connection insights
Get-NetTCPConnection
A PowerShell alternative that provides structured and detailed information about TCP connections, which can be more digestible than the standard netstat output.
Cybersecurity Applications
For those in cybersecurity, netstat can shine a light on potential threats lurking in your network:
Detect foreign connections
netstat -an | findstr [foreign IP]
Quickly check for connections to or from a specific IP address, a quick way to identify if your system might be compromised.
Audit all listening ports and their services
netstat -ano
Essential for spotting unauthorized ports that malicious services might be using.
Simple, yet effective, netstat commands across macOS, Linux, and Windows share a lot of similarities, with PowerShell offering a slight twist..
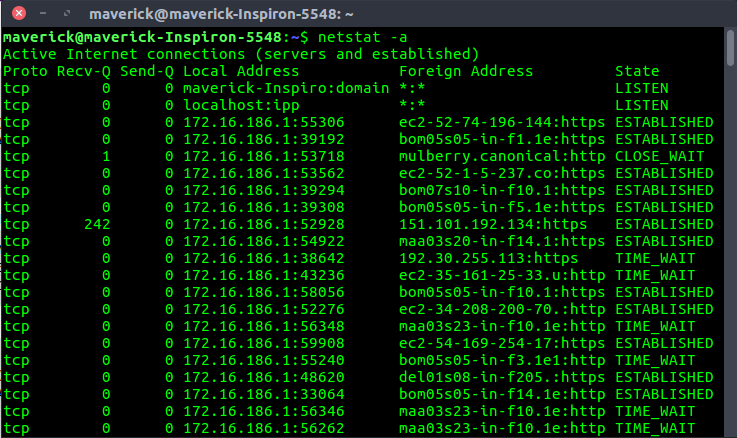
Here’s an example of netstat which i’ve grabbed somewhere online for you to see of netstat -a
The provided output shows the result of running the netstat -a command on a Linux or Unix-based system. Here’s a detailed explanation of the output:
- The command
netstat -ais used to display all active network connections and listening ports on the system. - The output is divided into columns:
Proto: The protocol used for the connection (TCP or UDP).Recv-Q: The number of bytes received that are waiting to be read by the application.Send-Q: The number of bytes sent that have not yet been acknowledged by the remote host.Local Address: The IP address and port number of the local system.Foreign Address: The IP address and port number of the remote system.State: The current state of the connection.
- The first two lines show the system’s hostname (
maverick@maverick-Inspiron-5548) and the command executed (netstat -a). - The output lists various network connections, including:
tcp 0 0 maverick-Inspiro:domain *:*: A listening TCP connection on the domain port (usually port 53) on the local system.tcp 0 0 localhost:ipp *:*: A listening TCP connection on the IPP (Internet Printing Protocol) port (usually port 631) on the local system.tcp 0 0 172.16.186.1:55306 ec2-52-74-196-144:https: An established TCP connection between the local system (IP 172.16.186.1, port 55306) and a remote Amazon EC2 instance (IP 52.74.196.144) on the HTTPS port (443).tcp 0 0 172.16.186.1:39192 bom05a05-in-f1.1e:https: An established TCP connection between the local system and a remote host on the HTTPS port.tcp 0 242 172.16.186.1:52928 151.101.192.134:https: An established TCP connection with 242 bytes waiting to be sent to the remote host.tcp 0 0 172.16.186.1:38642 192.30.255.113:https: A TCP connection in the TIME_WAIT state, indicating that the connection has been recently closed and is waiting for any delayed packets.
- The output shows various other established TCP connections to different remote hosts on the HTTPS port (443), as well as some connections in the TIME_WAIT state.
This netstat -a output provides an overview of the active network connections on the system, including listening ports and established connections. It can be useful for troubleshooting network issues, identifying open ports, and monitoring network activity.
4 Essential Networking Tools and Applications you need to know in 2025 (and their commands or filters!)
Tool #1 Nmap a.k.a Network Mapper
Nmap is a powerful open-source tool used for network discovery, security auditing, and administration. With Nmap, you can determine which hosts are available on a network, what services they are running, and what type of packet filters or firewalls are in use. This tool is particularly useful for network administrators and security professionals who need to assess the security posture of their networks. It is widely used for network inventory, managing service upgrade schedules, and monitoring host or service uptime. You can download Nmap from its official website: Nmap Official Site
The commands are the same across macOS, Linux, and Windows, as the tool operates through a command-line interface. Here are a few basic commands:
- Scan a single IP:
nmap [IP address] - Scan a range of IPs:
nmap [first IP]-[last IP] - Scan a domain:
nmap [domain name] - Perform a more detailed scan (service detection):
nmap -sV [IP address or domain]
Interestingly, Nmap’s utility extends beyond simple network scanning; it’s a foundational tool in platforms like the Nessus vulnerability scanner. My journey with Nmap began on Kali Linux, where it’s included out of the box. Using switches like -sV, Nmap enables the identification of networked systems, which is critical for effective cybersecurity practices. However, it’s worth noting that because Nmap can perform port scanning, it might be flagged as a hacking tool. This underscores a crucial point for my blog: always ensure you have authorization for network discovery to avoid legal and ethical issues.
Here are some highly useful Nmap commands that are central to IT auditing, cybersecurity, and even ethical hacking:
- Basic Network Scan:
nmap 192.168.1.1/24- This command scans all devices on the subnet to identify what hosts are up and running.
- This command scans all devices on the subnet to identify what hosts are up and running.
- Service Version Detection:
nmap -sV 192.168.1.1- Useful for determining what services are running on a machine and their versions.
- Useful for determining what services are running on a machine and their versions.
- Operating System Detection:
nmap -O 192.168.1.1- Helps in identifying the operating system of the remote host, which is crucial for further vulnerability assessment.
- Helps in identifying the operating system of the remote host, which is crucial for further vulnerability assessment.
- Aggressive Scan:
nmap -A 192.168.1.1- Performs a more aggressive scan to gather information about the device, including service versions and OS, but use with caution due to its intrusiveness.
- Performs a more aggressive scan to gather information about the device, including service versions and OS, but use with caution due to its intrusiveness.
- Scan Using Specific Scripts:
nmap --script=[script-name] 192.168.1.1- Nmap’s scripting engine (NSE) is extremely powerful for more sophisticated investigations like vulnerability scanning, discovery of additional network services, or security auditing.
Utilizing these commands can significantly enhance your understanding of the network environment, contributing to more effective network management, security analysis, and regulatory compliance. Always remember that with great power comes great responsibility, so use these tools ethically and legally.
In my network management toolkit, Nmap has played a pivotal role, especially when paired with custom inventory tooling projects developed in Python. This combination has proven invaluable for discovering and inventorying devices across various networks. By utilizing Nmap’s robust scanning capabilities, I’ve been able to quickly identify active devices and then assess their configurations. While Nmap itself doesn’t directly check services like Remote Registry or WinRM, it sets the stage for further scripting, where I use WMI and CIM queries to deeply analyze the systems discovered.
Tool #2 Wireshark: A packet capturing tool
Wireshark is a powerful network protocol analyzer that enables you to capture and dissect network traffic either in real-time or from a previously captured file. It provides a detailed view of each packet, supports a multitude of protocols, and can be a crucial tool for unraveling complex network issues, spotting security risks, or deepening your understanding of network protocols. My interest in ARP (Address Resolution Protocol), which is critical for IP addressing in Ethernet networks, grew from experimenting with Wireshark on my home WiFi network as a kid.
It’s particularly effective for exploring the intricacies of data passing through a network. My curiosity about what was traversing the network cable led me to discover Wireshark when I was younger. I even used it to hunt for clear text passwords flying across my home network—naughty, I know, but it was all in good fun and a great learning experience! This kind of hands-on exploration with Wireshark is what sparked my lasting fascination with network protocols and security.
To use Wireshark to capture and analyze ARP packets, you don’t need specific command line instructions, as Wireshark primarily operates through a graphical user interface. Here’s how you can set it up to capture ARP packets:
- Start Wireshark: Open the Wireshark application on your computer. OR DOWNLOAD HERE
- Select the Network Interface: Choose the network interface that is connected to the network where you want to capture traffic. This might be an Ethernet interface or a wireless interface, depending on your setup.
- Begin Capturing: Click on the ‘Start Capturing’ button, which is typically represented by a shark fin icon.
- Filter ARP Packets: To specifically look at ARP traffic, use the filter bar at the top of the Wireshark window and enter
arp. This filter will display only ARP packets, helping you focus on the relevant traffic. - Analyze the Traffic: Once you start capturing, look for ARP packets that show ‘who has’ requests. These packets are ARP requests sent by a device when it’s trying to find the MAC address associated with a specific IP address.
In the scenario I encountered at Pickerings Lifts, setting up Wireshark to capture on a network segment where the unresponsive managed switch was connected allowed me to quickly identify ARP requests broadcasted by the switch. As soon as the switch was plugged in and powered on, it broadcast an ARP request trying to find out the MAC address associated with its own IP configuration. This was captured and displayed in Wireshark, revealing the IP address the switch was configured to use, which we otherwise had trouble obtaining.
By monitoring ARP packets with Wireshark, I was able to provide a rapid solution to a problem that could have significantly delayed our networking operations. This experience not only helped resolve an immediate issue but also demonstrated the practical value of having deep knowledge of network tools and protocols
3# PuTTY: Telnet/SSH a common client used to remote to network devices (switches, routers, firewalls..)
PuTTY, a free and open-source terminal emulator is commonly used by IT professionals to securely access and manage servers and network devices remotely
With PuTTY, you can easily connect to remote systems, run commands, and perform administrative tasks from the comfort of your own computer.
The program supports a variety of network protocols, including SSH, Telnet, and Rlogin – which will allow you to remotely access common networking infrastructure. Such as networking switches, IT administators can and often use a combiantion these protocols to manage their devices.
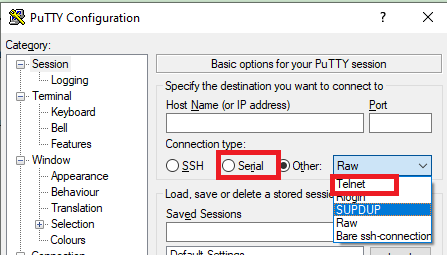
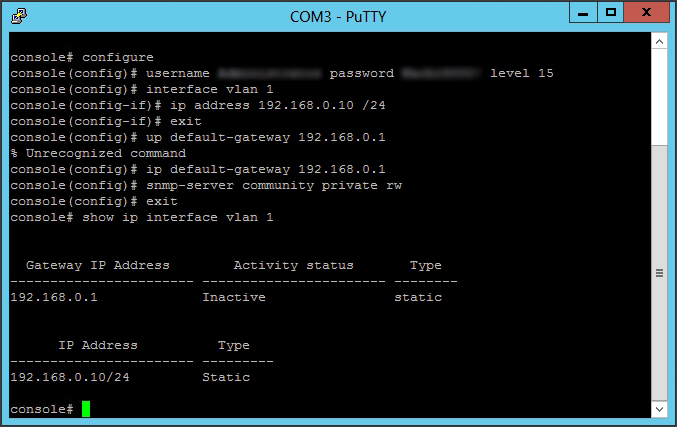
Here’s an example. A networking switch can be configured by either of the two protocols. COM and Telnet. You can configure Putty in the GUI to use a local com port / which is serial connected direcly to the switch from the laptop running the program… OR remotely go to an IP address via telnetz.
This image shows the command-line output of a network switch, where you can configure various settings like interface IP addresses, default gateways, and SNMP community strings for network management.
#4 Fiddlar Classic: A Versatile Web Debugging Proxy
As the fourth tool in our series, let’s dive into Fiddler Classic, a powerful web debugging proxy that has proven itself invaluable in various scenarios, from web development to network troubleshooting.
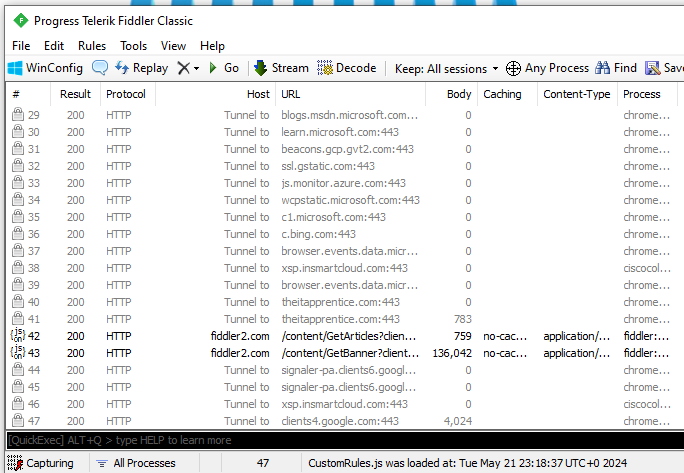
Fiddler acts as a man-in-the-middle between your computer and the internet, capturing and logging all HTTP(S) traffic. This allows you to inspect, analyze, and even modify the requests and responses passing through.
In my personal experience, Fiddler has been a go-to tool for web development. It enables you to see the exact requests your application is making and the responses it receives, making it easier to identify and fix issues related to API calls, authentication, and more.
But Fiddler’s usefulness extends beyond just development. I’ve seen it employed by security vendors when troubleshooting connectivity issues. Its ability to capture and display network traffic in detail makes it ideal for identifying problems related to firewalls, proxy settings, and domain policies.
In a previous job, we had a notorious proxy server that everyone despised. Whenever an application encountered issues due to this proxy, it would generate a specific error message. Using Fiddler, we could quickly identify the problem and apply the necessary exceptions to the proxy filter to resolve it.
Fiddler has also proven handy in troubleshooting Bitdefender policies and relay issues, as I recall from my time at Filtronic PLC. Its detailed logging and traffic inspection capabilities made it easier to pinpoint the source of the problems and find appropriate solutions.
While I’ve extensively used Fiddler for debugging authentication errors in web development, its applications extend far beyond that specific domain. Whether you’re a developer, a network administrator, or a security professional, Fiddler Classic is a versatile tool that can save you countless hours of troubleshooting and help you gain deeper insights into your network traffic.
So, if you haven’t already, give Fiddler Classic a try. It might just become your new best friend in the world of web debugging and network troubleshooting!
Frequently Asked Questions
What are the best network troubleshooting tools for 2025?
While the tools mentioned in this post (Ping, Traceroute, Nmap, Wireshark…) are expected to remain relevant in 2024, there are so many tools that offer additional features.
How can I improve my network troubleshooting skills?
To enhance your network troubleshooting skills, focus on gaining hands-on experience with the tools discussed in this post. Set up a lab environment where you can practice using these tools in various scenarios, and stay up-to-date with the latest best practices and techniques. Attend workshops, webinars, and conferences to learn from other IT professionals and expand your knowledge base.
Having a solid understanding of networking tools can help you tackle a wide range of challenges and make valuable contributions to your organization. By familiarizing yourself with tools, you’ll be better equipped to diagnose network issues, optimize performance, and assist with troubleshooting efforts.
Whether you’re an IT apprentice just starting out or a seasoned professional looking to expand your skill set, investing time in learning these tools can pay dividends throughout your career.
Join Our Community!
🌟 Get exclusive insights and the latest IT tools and scripts, straight to your inbox.
🔒 We respect your privacy. Unsubscribe at any time.